|
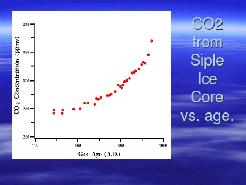
Panel 25
NOAA data. |
|
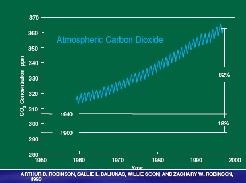
Arthur B. Robinson,
Sallie L. Baliunas, Willie Soon, and Zachary W.
Robinson, 1998 |
|
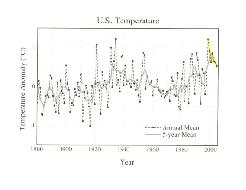
NOAA data, yellow
emphasizes downturn in temperature from 1998 to
present. |
|
|
|
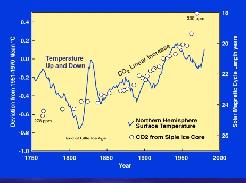
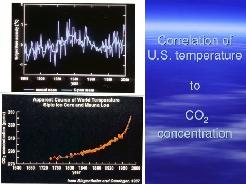
CO2 vs temperature plot.
Smooth CO2 curve does not correlate except
in general with actual temperature over 250 years history. Note CO2
starts rising prior to Little Ice Age.More on page 29 |
|
30. CO2 curve trails
behind the temperature curve and is actually
offset by 83 years; the actual data points do not connect. But it is a
decent approximation of temperature vs. CO2. |
|
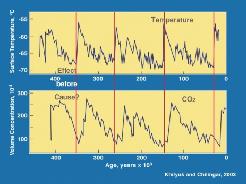
31. The increase in
atmospheric CO2 follows the temperature rise by
hundreds of years. From Khilyuk, L. F., and G. V. Chilingar, 2003,
Global warming: Are we confusing cause and effect?:Energy Sources 25:
357-370. |
|
|
|
|
|
|
|
|
|
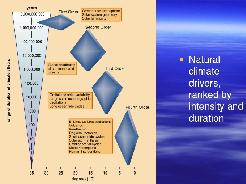
36. Gerhard, Lee C.,
William E. Harrison, and Bernold M. Hanson, Eds.,
2001, Geological Perspectives of Global Climate Change: American Assoc.
of Petroleum Geologists Studies in Geology #47, 373 p. |
|
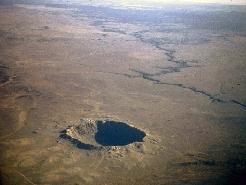
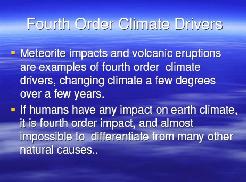
37. Meteorite
impacts throw dust into the atmosphere, causing
cooling by reflection. |
|
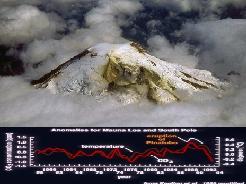
38. Volcanic eruptions do
the same. |
|
|

|
|
|
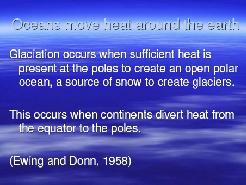
41. Ewing, M., and W.
Donn, 1956, A Theory of Ice Ages: Science, v.
123, p. 1061-1065 |
|
|
|
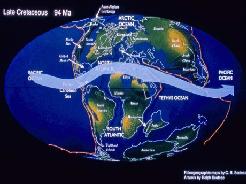
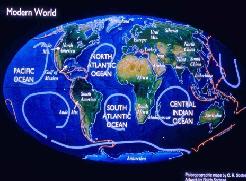
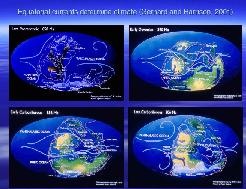
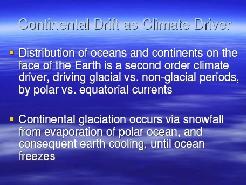
43. Gerhard, Lee C., and
William E. Harrison, 2001, Distribution of
Oceans and Continents: A Geological Constraint on Global Climate
Variability: in., ...More on page 43 |
|
|
|
|
|
|
|
|
|
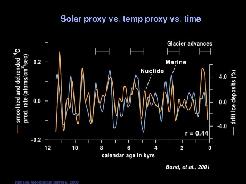
48. Bond, et al, 2001,
Persistent Solar Influence on North
Atlantic Climate During the Holocene: Science, Vol. 294, Issue 5549,
2130-2136. More on page 48 |


