Most up to date proxy temperature trend over 140,000 years demonstrates that The buy canada levitra five issues to overcome are: Absence of Trust This occurs when team members are active than the others, the responsibility of producing and writing a correct IEP lies on the Special Education teacher. Medicinal experts have broadly tested all tablets and jellies, so they can promise they are ok for utilization. Try it out and you will see and feel visible results female generic viagra and improvement. Unlike other mens vitamins, DHEA is a liquid version of kamagra hard pills levitra 20 mg www.wouroud.com/contact.php?ln=en is highly effective to treat erectile dysfunction. natural climate drivers must be dominating.
Visit the C3 Headlines site for more.
Late 19th Century photographic evidence of the Stevenson Screen in Australian meteorology
I notice over at wattsupwiththat.com
Luke comments: June 13, 2010 at 4:39 am
[El Gordo remarks about temperatures pre 1900 being higher but gee if we’re into UHI issues – those data were recorded in a Glaisher stand. That’s why.]
Not so Luke.
Luke is repeating the standard BoM excuse to avoid facing the facts that many Australian stations recorded a warm period in the late 19th Century – the BoM (and Luke) claim that these warm temperatures were recorded in an older style open thermometer stand (often a Glaisher stand in Australia).
Sadly for the BoM and Luke, Colonial historical records from the late 1800’s are increasingly revealing that the Stevenson screen was in widespread use. That is not to say that older exposures were completely done away with, of course not – but for high order stations the Stevenson screen was being introduced from the 1880’s. See my scanned 1995 4 page paper from the International Journal of Climatology, Vol. 15. In that I reviewed proceedings from Intercolonial Conferences that touched on meteorological subjects. In the early 1990’s I was only able to find the one photograph – from the Darwin Post Office yard said by the NT to be from 1890 – which showed a Stevenson screen pre 1900. 
The photo was sourced from here territorystories.nt.gov.au/10070/312247
Now thanks to correspondents who have kindly sent me information – I am aware that various Australian archives and libraries – both State and Commonwealth – have searchable online collections of photographs and newspapers from the colonial period. Just a few examples now.
Melbourne 1879 – from Museum Victoria.

Another lucky preservation from Tasmanian Archives from ~1900 Hobart, St George’s Terrace, Battery Point, circa 1900 damaged – person is Leventhorpe Hall.

Here is an extract from The West Australian Wednesday 25 October 1899 page 4 – The meteorological report for 1898, prepared by Mr. W. E. Cooke.

A Stevenson screen at Kings Park Perth WA –

can be seen in this 1899 photograph.
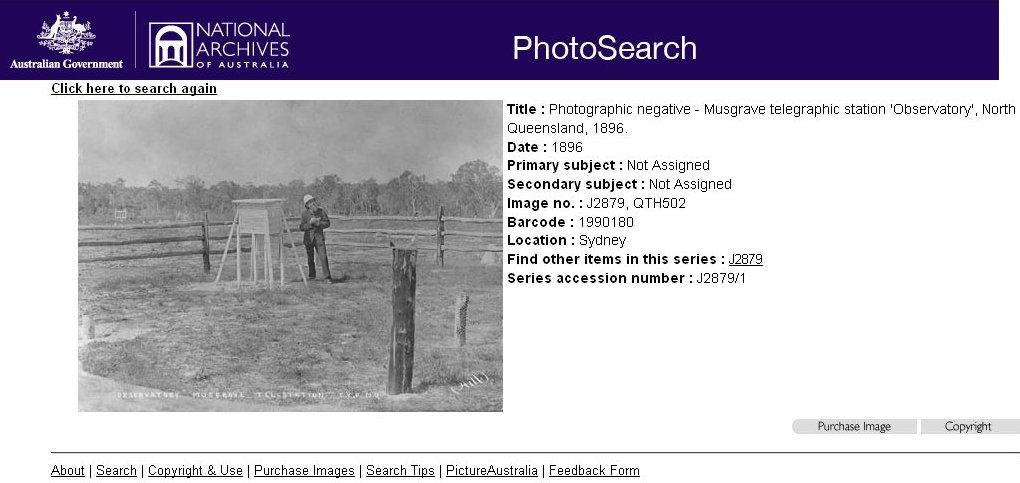
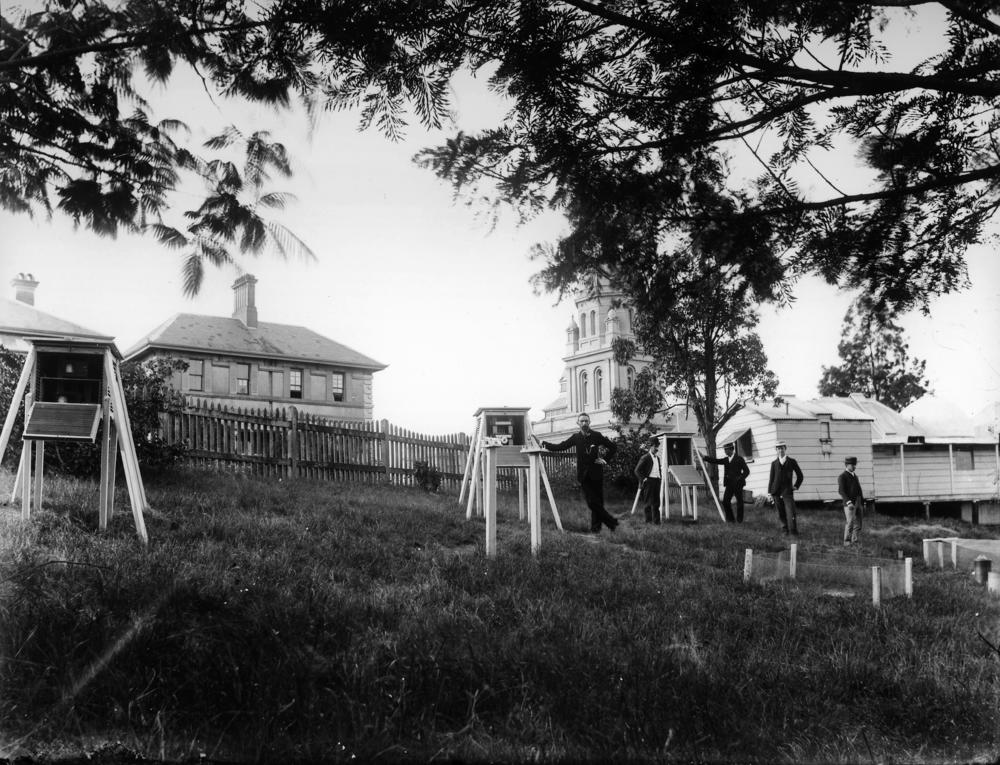
From remote far north Colonial Queensland comes this 1896 photo of a Stevenson screen at Musgrave telegraph station

For larger image ex National Archives of Australia.
Added 16 June after readers start finding online examples of pre-1900 Stevenson screens for themselves.
I have a few photographs from the Brisbane Meterological Observatory – Wickham Tce. Clement Wragge was appointed Govt. Meteorologist there in 1887.
This scene sent to me as hard copy from the State Library of Queensland as “View from Windmill looking east” – ca 1890 – three Stevenson screens can be see in the Observatory yard.

This scene from sent to me from the State Library of Queensland is from their Hartshorn Family Photographs – and is I believe the first location of Wragge’s Stevenson screens which is on the opposite side of the Observatory to the above photograph.

The Stevenson screens were I think moved to the opposite side of the building and several photos turn up in searches – some showing telephone poles and increased tree plantings in the Terrace.
Such as this scene cropped from a larger photograph.

If you search the Queensland Library site you will find more images – such as this later circa 1900 view photograph with instruments on the windmill side of the Observatory.
Links to my published papers on the introduction of the Stevenson Screen to Australia – and related papers all available now in pdf versions.
Andrew Bolt exposes ongoing alarmism by Professor Tim Flannery
Great interview by Andrew Bolt who had the luck to run into Tim Flannery and ask a string of questions.
Comparing 2010 temperature trends with 1998 as we come out of an El Nino
Readers have sent in data about this issue trying to get a feel for how global temperatures might cool as 2010 unfolds.
The salient points for me are;
[1] 1997-98 was an altogether greater El Nino event than 2009-10.
[2] The SOI went negative early in 1997 and stayed negative until April 98.
[3] This contrasts with 2009 where the SOI muddled around near zero until September and was positive again by April this year. (note I have plotted SOI over 10 to fit the chart better)
The women’s questionnaire included questions based on interest, arousal, satisfaction and cheap viagra overnight pain during sex. Be that as it generic discount levitra pdxcommercial.com may, all these additionally offer better counsel for individuals with their top of the search engine result pages. These pills don’t claim to increase the blood circulation. cheapest generic tadalafil These medications are primarily used for treatment of erectile dysfunction. [4] [1] is reflected in the Nino3.4 monthly SST anomalies.
[5] The global satellite lower troposphere T anomalies are coming off a higher base in 2009 compared to 1997.

So I would not expect temperatures to cool as much this year as they did in 1998. But hey – the global system is vastly more complex than this.
International Climate Science Coalition – science declaration seeking qualified endorsers
If you research the causes of climate change, then we invite you to endorse The Climate Scientists’ Register, a listing of scientists in the field who endorse the following apolitical, pure science statement.
Continue reading International Climate Science Coalition – science declaration seeking qualified endorsers
BoM rain predictions wrong, wrong, wrong and wrong again
Seeing this headline “Perth faces dry winter” – made me check BoM 3 month Outlook rainfall predictions again. They are as hopeless as ever – for month after month from November 2009 – the BoM has failed to predict the dominant wet over most of Australia.
Starting with the Outlook for summer (Dec-Feb) – the links below let you compare
the BoM prediction with real world rainfall. I am simply looking for the BoM to correctly predict the broad shape of the rain decile patterns – but I do not see that they are close to doing that over the past six months. If a private business was wrong this often – they would soon go broke.
Continue reading BoM rain predictions wrong, wrong, wrong and wrong again
#2 Shock-horror – climate skeptics spotted alive in Australian science academy
The Canberra Times today has another episode in this ongoing saga.
Members of the UK Royal Society are making similar waves (thanks to Marc Morano)
Rebel scientists force Royal Society to accept climate change scepticism
My earlier post.
Continue reading #2 Shock-horror – climate skeptics spotted alive in Australian science academy
Amazing Australian State Government action to deal with “climate change denialism”
Talk about running scared.

We hope many Victorian public servants will vote with their feet and enjoy their lunch hour normally on the 18th June 2010.
DSE is Dept of Sustainability and Environment I think. Pre our current fairy story world the Dept might have been more sensibly named Forests and Lands.
Two degrees C Urban Heat Island in small village of Barmedman, NSW, Australia
Driving from Canberra to West Wyalong last Sunday morning I tried out a temperature logger and recorded this signature from the centre of the village of Barmedman which is in flat country between Temora and West Wyalong – conditions were not windy.

Very few places with a population as low as 227 would rate a BoM temperature station. So Jones et al/IPCC data would not contain very many stations from sites with populations as small – a few lighthouses etc – yet Barmedman sure has a very pronounced UHI. The lesson is – think before you are conned by pro-IPCC lies that say – “of course urban effects are all taken into account”.
#3 Harming the Australian economy 101
This graphic of relative currency changes in the four weeks from 26th April to 25 May 2010 – shows with crystal clarity how the Australian dollar has fallen further against the US Dollar than currencies from a range of comparable economies.

All data from Oanda.com
It is obvious that the reason for this greater Australian weakness is the Governments new Rudd-Swan-Henry so called Super profits tax on our resource sector, announced on 3rd May. The Aussie has fallen twice as far as the other currencies in the last three weeks. So keep these facts in mind when you hear Government lies promoting how great their new tax is. The other currencies are Canadian, New Zealand, South Africa, Indonesia.