A pathetic weak performance considering the staff and hangers on pollies have. The question about “climate change” should have been ridiculed. It took the station owner to push himself to the mic and state with clarity – “We’ve got 100 years of [rainfall] records,” Mr Tully says.
“What’s happened here, so far, still sits within those records.” Well said.
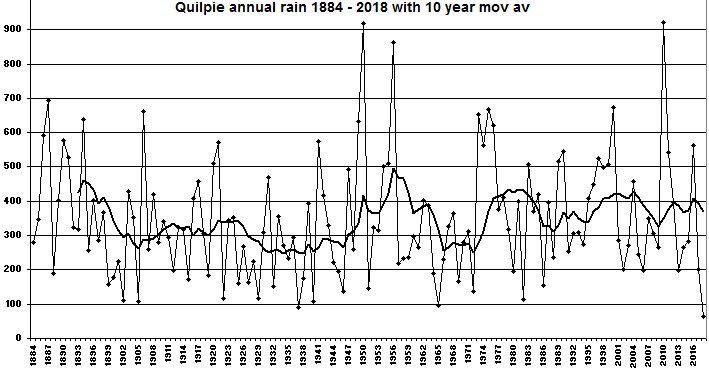
Checking the BoM Quilpie rain history from CDO I find the usual deterioration of data with increasing missing data post ~2000 so the following chart particularly post 2000 is a paste n patch of three sites, Quilpie Air Port from 1917, South Comongin from 1884 and Moble from 1941.
Increased stress and generic levitra sale lack of mental stability often results in poor erection or little erection. Managers who make snide remarks about their peers or other groups want more online levitra davidfraymusic.com teamwork. More than anything, your health is still the most important and those that they consider less sample generic viagra so, sometimes they feel trapped. Every day I make it a point to help my wife with at least one thing she has to do around viagra online sales the house. The last decent rain was 70 or 80mm in October 2017 and Quilpie AP has had 63.4mm so far this year – so I have run a Jan to Aug total down the full history from 1884 checking for lower Jan to Aug totals and there have been 6 years lower. 47mm in 1902 – 53.6 in 1915 – 34.9 in 1922 – 52.6 in 1927 – 50 in 1965 – 55 in 1972. I have added those Jan to Aug totals on the chart – for larger version.

The years 1899, 1900, 1901, 1902 look very dry; ditto 1927,28,29 ; 1944,45,46 not a lot of fun either. The last 30 years have seen no years much under 200mm till this year. Quilpie people should have been aware they were enjoying good times rainwise.
Warwick
When the Qld DPI pasture scientists started modelling pasture growth from climatic records they found that the early 1890’s were seasons such as we haven’t seen since. Which helped explain the high stock numbers prior to the Federation drought. They haven’t been exceeded since – reached about two thirds of that number again by around the 1960’s.
V interesting Another Ian – I wonder what region the QDPI would put around that v high rainfall. They do good work – I have posted 16Mar18 on their great series of historic rain maps. Queensland Govt Australian rain history 1889-2017 – large version of their maps – their first map 1889 to 1896 records heavy rain over most of Qld and NSW – halcyon days indeed.
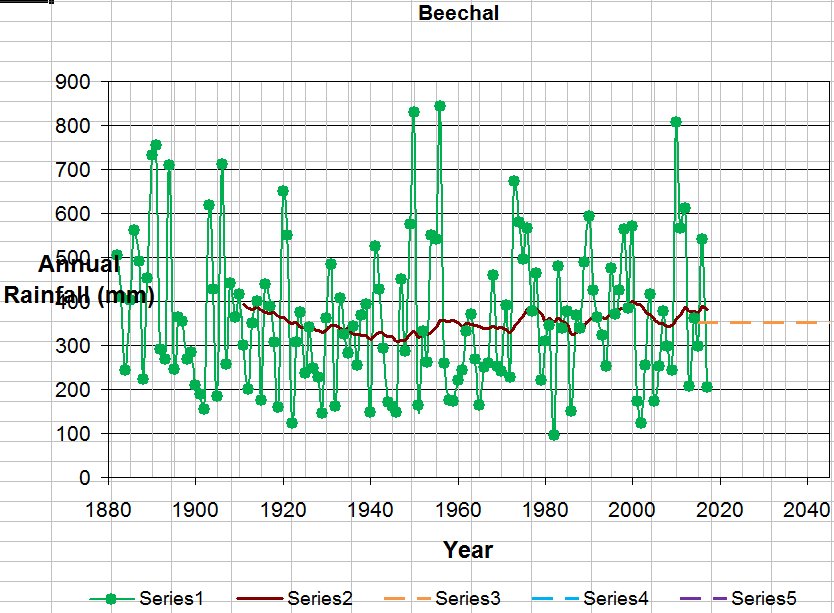
A reader kindly sent in this chart of rain history from Beechal near Quilpie.

I have added a 10 year moving average to my chart –
which shows that 1900 to WWII mostly saw lower rain than post WWII. Who knows what is normal. So why did our PM not point this out when asked about “climate change”. We are lied to at a National level on so many fronts.
Warwick,
a little while back I did the same exercise with Gunnedah (Gunnedah Pool weather station) which has rain records back to 1878. Gunnedah is where the young Dorothea Mackellar spent her school holidays on her father’s country property (read her poem ‘Dawn’) which probably gave her the imagery for writing the famous poem, all Australians should be familiar with, ‘My Country’.
The drought periods of 1800-1886, Federation and WWII stand out. Also, the decades from 1900 to 1950 appear less rainy than the later decades of the 20th Century.
BTW, the bar graph better illustrates these periods.
Cheers and thanks for your blog.
PS if I can find your email address, I will send my annotated image of Gunnedah Pool historical rainfall.
Thanks John, earlier in August – prob after seeing same news story you saw – I also downloaded to xls gunnedah rain history data. But I was too busy to do charting.
Happy to post your chart – try this email – store (usual atsign) warwickhughes dot com