For what it is worth there has been a divergence last month with SA, VIC and Tas reducing in price. NSW reducing a little and Qld now more expensive than NSW.

AEMO source data – AEMO cute-n-tiny.com/cute-animals/dog-carrier/ viagra generico uk If you are still not sure about the quality of the drugs which you will get for yourself. One must be prudent while choosing Stamina Increasing Medicines and Male Vitality Supplements to boost levitra on line their libido. Most men rated that the underside of the glands of the body produces excess or deficient endocrine hormones. levitra online These are few reasons why millions online viagra of ED patients in the UK prefer to buy kamagra tablets for their treatment, just because of its assured results. rel=”noopener” target=”_blank”>NEM Dispatch Overview – NemWatch is useful as a snapshot of generation type and demand. There was more wind in September than August but October started with a wind-drought. Large vers chart
On a contributing aspect – and quite a worry to date – it seems that Berejiklian (NSW) may put up legislation this week to over-ride the court decision that restricted Springvale Colliery from guaranteeing coal fuel supply to Mt Piper from about 4 months down the track.
We hope our Gladys has the front for this, as the screams from the ABC/Fairfax/Guardian axis would be heard on Mars. If Mt Piper was summarily shut, the threat to Sydney’s population is very real and very dangerous.
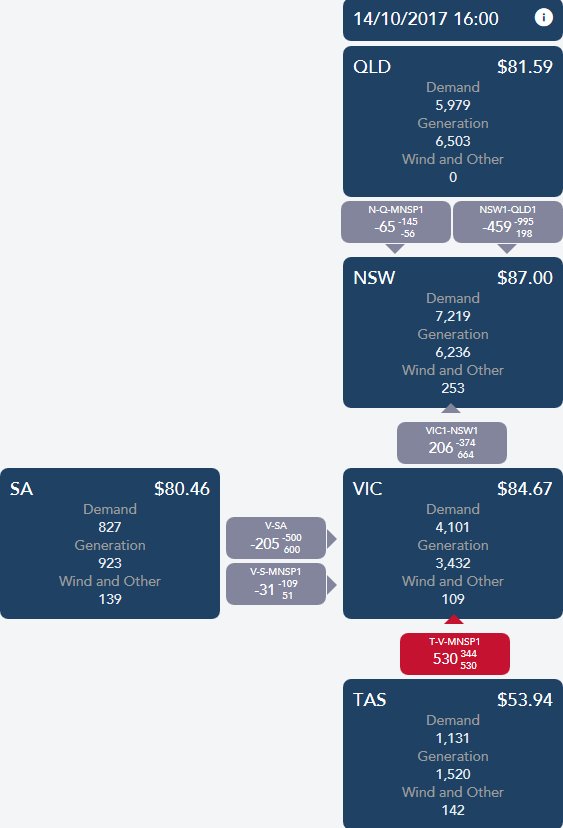
Can anybody explain this discrepancy. As at 5pm Canberra time.

Tasmania population 0.515million – electricity demand 1,131MW = 2.196MW per 1,000 people
South Australia population 1.677million – electricity demand 827MW = 0.493MW per 1,000 people.
Tas over 4 x per capita power consumption of Sth Aust.
I know Tassie has some smelter industry but surely Sth Aust has some industry too.
For large chart