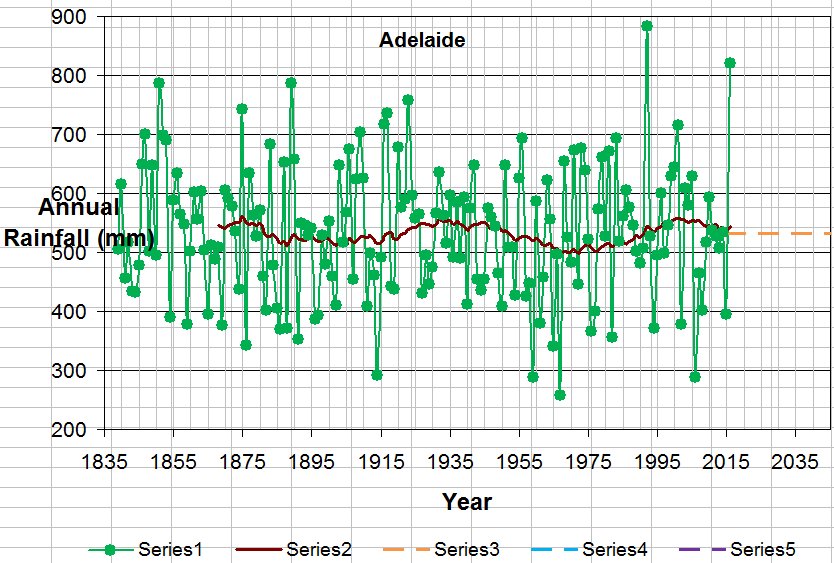
A reader mentioned to me that Sir George Kingston had kept rainfall data at Grote Street Adelaide from 1839-1878 and that data was in the South Australian library. The BoM has added the first 22 years of the Kingston data to West Terrace making West Terrace start in 1839 – I have added Kent Town post ~1978. This chart as per BoM – The Grote Street data is v slightly different 1839-1860 – then a bit more different 1861-1878 – I can add that later. I am sure there will be points to comment on – but I found it interesting that 1974 is not noteworthy despite Lake Eyre filling. Large graph.

For Sir George’s sake, I hope there is not a statue of him somewhere.
Lake Eyre fills after rains in Interior QLD. There is almost no flow northward from SA.
Found two little tables with some rainfall data from various parts of Adelaide around those times here. trove.nla.gov.au/newspaper/article/28788686
More tables mentioned here. trove.nla.gov.au/newspaper/article/788939
That book is on disc at the National library or for sale here.
www.gould.com.au/australian-almanac-1859-waugh/au2118-1859/
Entertaining skim read that Almanac, little glimpse into pioneer times.
Warwick,
I have been working on long term rainfall trends for several locations in Tasmania back to the start of the 1900’s looking at it from the null hypothesis perspective. If you have the Adelaide data in a spreadsheet and could send it to me I can do an analysis for you and send it back. I could also share what I have found for the Tasmanian locations. I think you would find it interesting.
cheers, Basil
Here’s another story Warwick about Perth dams filling: www.perthnow.com.au/news/winter-rain-fills-perth-dams-to-highest-levels-in-decade/news-story/5a77e9b5ad92732776aee06ce8e76191
Thanks for noticing that Tom – I plan to blog on Perth dams next week.
Great quotes in the article.
Chart kindly sent in by a reader. For large chart
