Perth media runs this story – Utility pleads for more water
I have written on this subject for more than a decade – here are just two landmark examples.
[A] There never was a rain shortage to justify seawater desalination for Perth’s water supply – Dec 2007 download my 200KB 3 page pdf “Perth water supply catchments rain report Nov 07” Still covers main issues.
[B] Ongoing decline in efficiency of Perth Dam catchments – reply from WA Minister – May 2013 – Read what I wrote to Minister Marmion and his reply – he could not contradict my point that catchment management would increase runoff to dams.
Updating to 2015 rainfall the 5 year average rain 2011-2014 is about 850mm. Below is the latest chart of Perth catchments rainfall May-Oct rainfall 1980-2015 which shows CE (Catchment Efficiency) plunging to under 2%.

What the West Australian Government (and Labor Opposition) should be doing in respect of Perth water supply policy.
1. Over-ride Green objections and manage catchments as they were in the mid 1990’s thus increasing dam inflows by an amount of water about equal to production from two desalination factories (=90 GL Per year). See graphic of declining catchment yields above. Thinning of catchment bush can be done by experts with negligible adverse effects on wildlife values. Download 1 page pdf with chart showing results of thinning the Higgins catchment near Dwellingup – from 2005 Water Corporation report.
2. Cut the Gnangara pines forthwith – the value of the trees is way less than the value of the water they are suppressing. Sell the lumber and use the land for well planned urban areas – make a huge profit from well planned new suburbs and increase underground water pumping potential by about 100 GL per year, (UWA figures from 2002). Let both mounds recover over the decades ahead. GoogleEarth images show that between 2004 and 2015 significant areas of the pines have been cleared – that will assist recharge of the Gnangara mound underground water.
3. Abandon the risky plans to pump treated waste water into your precious shallow aquifers.
4. Take on board the Agritech proposal to desalinate brackish Wellington dam water but examine augmenting it to 100 GL per year by adding similar brackish water from the Murray or Avon where hundreds of GL flow to the sea every year.
5. After seeing the benefits from 1, 2, 3 & 4 above, progressively mothball both seawater desalination factories and save taxpayers mega $’s’.
6. Engage an expert US group to trial cloud seeding for a few run-off seasons – the cost is low compared to the large value of any incremental water in dams.
7. Stop lying to the public about rainfall – let the slogan “Our drying climate”pass into history where it belongs. Instruct Water Corporation to quote catchments rainfall on their www pages and NOT Perth rainfall which does not run into dams.
8. Instruct Water Corporation to get on with their job of harvesting available falling-from-the-sky-free natural water at the lowest cost possible for the benefit of the Perth and WA public.
9. If CE (Catchment Efficiency) was increased to 5.6% – hypothetically the 19 years 1997 to 2015 would have produced an extra 64GL each year on average – taking out the 4 poor years, 2001-2006-2010-2015.
If you take the last group of good years 2011-2014 incl. the loss is worse and 116GL PA is being lost. Now what is the value of this lost water? Is it near a $Billion PA?
I guess some of the water problems will have been helped with the current system moving through. Reminds me of one in 1982 that flooded much of the South West and Great Southern, drowning Nannup and flooding other towns along the Blackwood River, in February of that year.
Little rain this month seems to have gone into Perth dam catchments – but the rain system is still rotating around the Perth radar.
www.bom.gov.au/products/IDR702.loop.shtml#skip
The 1982 Nannup flood was caused by a rain event 21st & 22nd Jan 1982 which was the tail end of cyclone Bruno –
www.bom.gov.au/cyclone/history/bruno.shtml
yet Nannup only got 51.6mm on those 2 days – there was much more rain up the Blackwood catchment.
www.bom.gov.au/jsp/awap/rain/archive.jsp?colour=colour&map=totals&year=1982&month=1&day=21&period=daily&area=wa
The WW had a story which is in Trove.
trove.nla.gov.au/ndp/del/article/55187686
The last few days rain in the SW has produced some flash flooding – the ABC headline says – Flash flooding follows fires as south-west WA experiences heaviest rainfall in decades –
www.abc.net.au/news/2016-01-19/flooding-follows-fires-south-west-wa/7098916
I doubt that is quite accurate but headline writers have a licence.
For this month up to the 19th quite a large area of SW WA is already way over January av rain and often by large %’s.
www.bom.gov.au/jsp/awap/rain/index.jsp?colour=colour&time=latest&step=0&map=percent&period=cmonth&area=wa
Average Jan rain is not much in SW WA. Yet as that map shows Perth and Hills have not shared much so far in this months falls.
Catchment management should contribute to fuel reduction too thus reducing fire risk, a topical topic in WA lately. Your Higgins catchment one pager was an eye opener. So they knew exactly what to do and had a good idea what the runoff gains might be.
I seem to remember some cloud seeding trials about 3 decades again after a series of poor rainfall years. Less than successful, or it would have kept going. The problem was going to be, ‘who pays’.
Cloud seeding has quite a history in Australia Tom – I must get some pages up pulling it all together. Kicked off after WWII in NSW when surplus aircraft abounded. Still being used by Hydro in Tasmania I understand. Dr Ian Searle ran that operation for many years. In 2002 he submitted a pdf report to a Fed Parliamentary committee and I hope to convert that to html soon.


This page on Tasmania is from Searle 2002.
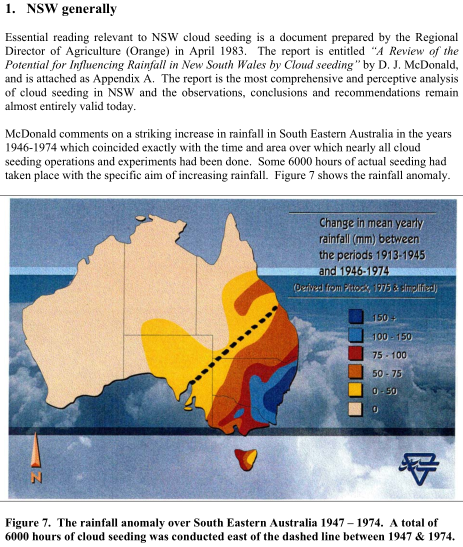
This Fig 7 of his shows the rain anomaly that could well be due to cloud seeding – of course it would be politically incorrect to accept that.
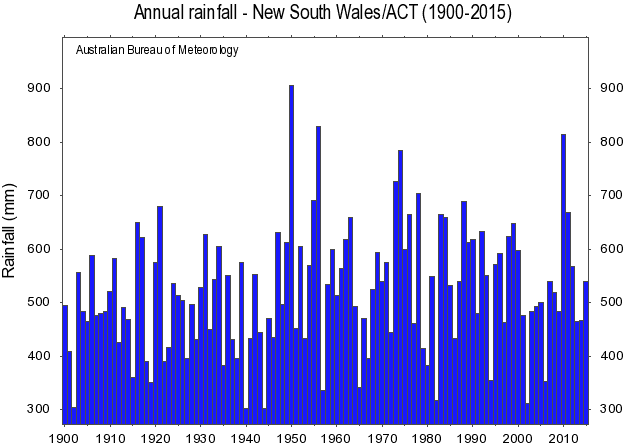
Chart of all NSW rain history showing the big jump in rain in 1950 which was a La Nina year – but I bet there are other La Nina years much less wet.