Remember the post two years ago by JoNova – Extreme heat in 1896: Panic stricken people fled the outback on special trains as hundreds die.
Since then of course the BoM has shouted to the rooftops that January 2013 was the “hottest evah”.
This issue has been given some impetus after the speech in parliament by the MP for the Federal seat of Dawson, Mr George Christensen. In his speech – which you can see on YouTube – Mr Christensen made the point that the 1896 heatwave was hotter than anything we have known in recent years.
I thought I would start by posting a series of BoM maximum temperature anomaly maps of 14 Australian hot Januaries from 1932 up to recent years. All maps made at this BoM site which will not go any earlier than 1911. I am working on a map for January 1896 –
Excellent work Warwick. I dips me lid!
From the ABC TV 7 o’clock news (which was painful to watch) Obama has swallowed that tripe of 2013 being the hottest year which is not true for the globe (UAH &RSS) or for Australia (raw BOM)
It is time the ABC was shut down or privatised.
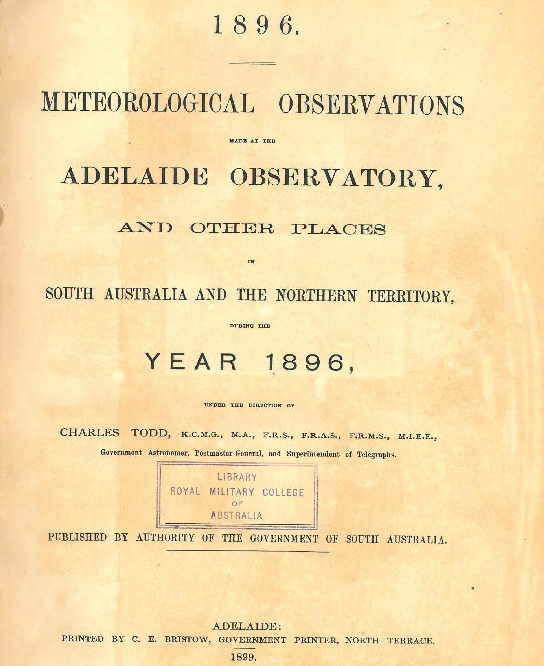
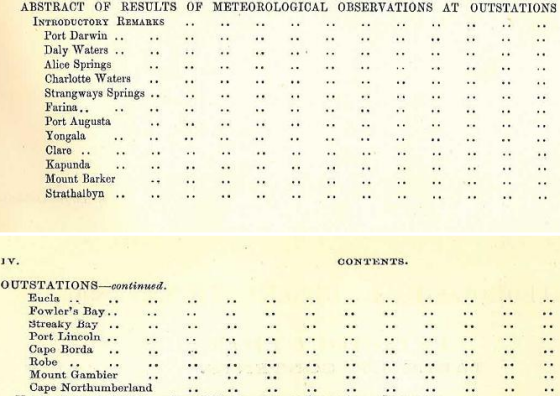
Reader “siliggy” has emailed pages from the following book he found in the NLA – there are volumes for other years and other states or colonies.


This list of outstations are mostly well known met station names but I have never heard of Strangways Springs –
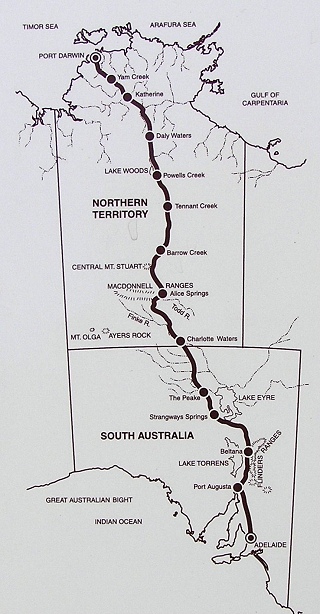
Which got me searching the route of the Adelaide-Darwin telegraph line and I found this map – There must be better maps. Assuming these place names are all telegraph repeater stations – would they all have been issued with weather instruments ?
I have not come across met stations – Yam Creek, Powells Creek, The Peake, Strangways Springs, Beltana – Maybe some names have changed.
The Peake #17109 shows up in CDO with 1884-1891 monthly rain data
Beltana Roadhouse #17119 shows up in CDO with 1986-2014 monthly rain data
What I take away from these extracts siliggy has sent is that there is much more 19C monthly temperature data waiting to be digitised than I thought. I had also formed a view that much 19C Queensland temperature data had been lost but maybe Clement Wragge published a string of these annual weather digests too.
In that book Sir Charles Todd notes that some of the stations were Stevenson screen but some were Greenwich stand. Wazah perhaps comparing them to your map may help to tell them apart. He also notes that Strangways closed in September 1896 and that the instruments were moved to William Creek 23 miles NNW.
As for better maps, Strangeways Springs and even good music, just follow what dissapears to find the pea under the thimble.
web.archive.org/web/20120321123602/http://www.connectingthecontinent.com/singingwire/toddsdream.htm
web.archive.org/web/20120322034216/http://www.connectingthecontinent.com/strangways/strangways.htm
Failing that I am sending you Lat and Long for each.
Hope these old links work!
web.archive.org/web/20120321172730/http://www.connectingthecontinent.com/virtualtour.htm
Here is another link that may not work.
catalogue.nla.gov.au/Record/690257?lookfor=results%20observations%20victoria&offset=2&max=89
And another.
catalogue.nla.gov.au/Record/1998231?lookfor=results%20observations&offset=6&max=9814
I don’t have the 1896 Adelaide Observatory document but I’ve got two of its pages listing maxima from 1 Jan to 26 Jan 1896 at 20 locations across Australia. I’ve no idea if the full document has the last few days of Jan or other stations. I thought I’d compare the available 1896 Todd data with Jan 2013, Australia’s hottest ever month, just for a laugh.
There are a fair few days missing in Todd’s 1896 report but there are still 16 locations where up to 26 days can be compared with their corresponding locations and durations for Jan 2013.
The Todd temps are rounded in F but the 16 stations average 36.4C in the first 26 days of 1896 and 36.4C in the first 26 days of 2013.
1-31 January 2013 at the 16 stations averaged 35.7C, so the heatwave had passed by 26 January last year. It may or may not have passed in the last five days of 1896.
Todd actually lists 20 locations, four of which no longer operate, but if you substitute the closest currently operating stations, 1-26 January 1896 averaged 37.0C, 1-26 January 2013 averaged 36.9C and the full January 2013 maximum average at the 20 stations was 36.3C.
January 1-31 2013 averaged across Australia at 36.92C to be the hottest ever month.
The hottest day at the 16 directly comparable Todd stations was 5 January 1896 with an average 41.3C. At all 20 stations, 5 January 1896 was 41.5C. That compares to 7 January 2013, Australia’s hottest ever day, at 40.3C across the country.
A spreadsheet including the original Todd document pages is at www.waclimate.net/january-1896-maxima.xls
There are way too many variables including Glaishers and UHI for this to be a valid comparison (I said it was for a laugh) but it makes you wonder.
Two interesting things about Charleville in January 1896.
“The official readings at the Post Office are lower; but the instruments used are placed in a thickly-planted garden which has been heavily irrigated during the last week, and they do not record the temperatures prevailing under normal conditions existing here.”
trove.nla.gov.au/ndp/del/article/79762915?
and
By January 23 1896
“The oflicial records show that the average daily ma.ximum of shade temperature since the beginning of the year continues 109′.”
trove.nla.gov.au/ndp/del/article/98565239?
Wel the modern average for there is 35 degrees C. It would have cooled After the 109 average but that is 42.8 Degrees C (+7.8 above the average). For the map it would be fair to correct for the irrigated garden but less the last week. We need the daily data for Charleville that month.