This is addition to my post a few days ago – Even Giles minimums adjusted in BoM ACORN “Roll Royce adjusted to warm more” temperature dataset –
I thought it might help to home in on 1997 which was the last year of ACORN adjustments – for some reason Giles BoM staffers achieved perfection on 1 Jan 1998 and except for a few days rejected by ACORN maintained accuracy to end 2013.
This chart shows Giles 013017 ACORN adjusted temperature minus daily minumums for 1997. Remember that there were no ACORN SAT adjustments to raw maximum readings.

On 301 days BoM professional observers read the minimum temperature too warm – on 6 days they got the reading exactly right and on 58 days they read the minimums too cool.
We must remember that the BoM staffs the Giles Meteorological Office – these are not amateur part time instrument readers. So these numerous and often large errors as recently as 1997 take a bit of getting in perspective.
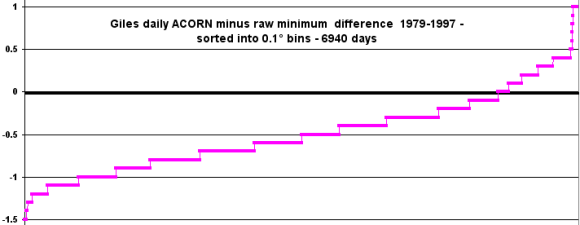
This chart shows the ACORN minus raw numbers sorted and an interesting result emerges that the zero change bin is very small.

I am no statistician but would not these adjustments be expected to show a normal distribution? If so the 0 bin should be larger – similar to the bins either side.
I wouldn’t expect a normal distribution of adjustments. If anything, I ‘d expect a skewed distribution as they adjust for whatever bias exists (real or not).
But that distribution between 1C and -1C looks random. Which suggests to me ad hoc adjustments.
Firstly; according to the BoM their staffers got the temperature wrong 359 days out of 365 ??
Secondly, according to the BoM their staffers could only read the temperature with an error range of +1 to -1.5℃ ???
Seems the requirements for employment in the BoM were (are?) extraordinarily low.
Here is a chart for period 1979-1997 – the 0 bin is still smaller than the +0.1 and -0.1 – Looks very similar pattern to year 1997 in post above above. I like the way the +1° bin is larger than the bins from +0.5 to +0.9°.
