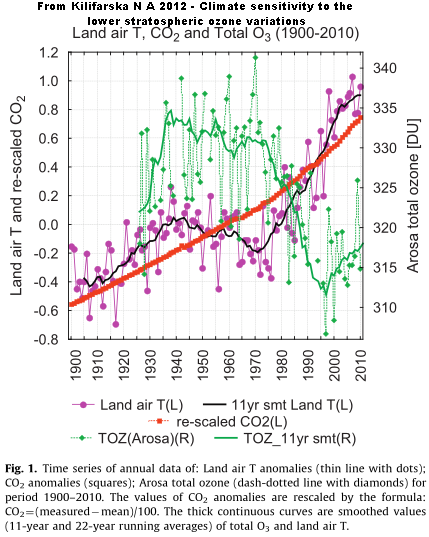
I have looked at the ozone hole issue a few times over the years – and have had a suspicion that various factors affect stratospheric ozone levels apart from destruction wrought by gases released from old fridges and freezers.
In the previous post the graphic indicates that ozone and temperature could be more congruent in the early years 1978-1985.
Out of curiosity I compared TOMS monthly data ex KNMI to the Arosa ozone series from Switzerland.

Lo and behold – TOMS numbers look too large in the early years too.
The KNMI TOMS series is a blend with more recent data from the European Space Agency SCIAMACHY ozone data. TOMS having ended in 2007.
R.I.P. TOMS: NASA Ozone Instrument Laid to Rest After Three Decades
Interesting comparison. A similar comparison is made here: www.knmi.nl/omi/publ-nl/missie/missiedoel-1.html but with absolute values, not year-on-year changes as you show. Your graph makes it easier to see patterns in the divergences. TOMS is consistently higher than Arosa from 1979-88, then the two track pretty well for the next 20 years, with a tendency for TOMS to have a higher amplitude and overall to be running higher than Arosa again after 2002.
Frustrating that it’s hard to see an up-to-date long-term Arosa data series. They are still collecting it, and the Swiss weather bureau publishes the figures for the last two weeks here: www.meteoschweiz.admin.ch/web/fr/meteo/ozone_layer.Par.0005.DownloadFile.ext.tmp/grand.gif. And the data appear to be lurking here: ftp.cpc.ncep.noaa.gov/ndacc/station/arosa/ames/dobson/ for those with the requisite data extraction skills.
David, I am not too good at reading Dutch but pressing the English flag gets to some other sites -here is one www.knmi.nl/omi/news/archive/fullFiles/2013-11-04_ozone_hole_2013_en.php, You can then get to a site concerning Temis and another which defines Dobson units which mentions that the average for the world is about 300 Dobson units. KNMI has some useful data. Also, at KNMI there are many who are true scientists and will listen to all points of view with regard to climate. The late Dr Noor Van Andel gave this interesting presentaation in Sept 2010 to KNMI climategate.nl/wp-content/uploads/2010/09/KNMI_voordracht_VanAndel.pdf
Still no updated Arosa ozone series – but we keep trying.

Ozone research by Dr Natalya Kilifarska – lots of interesting looking titles there –
bas.academia.edu/NatalyaKilifarska
Thanks for links, cement, will give them a gander. And nice graph Waszah. Kilfarska [http://www.academia.edu/2005737/Mechanism_of_lower_stratospheric_ozone_influence_on_climate] takes up Doug Hoyt’s suggestion [http://www.warwickhughes.com/hoyt/climate-change.htm] that decreased stratospheric ozone could be responsible for warming:
“IPCC and contemporary climate models believe that this [increased upper troposphere water vapour] is a result of the increased evaporation from the warmer Earth’s surface. However, until now there is neither theoretical no[r] experimental conformation of this assumption. Oppositely, we show that the increased water vapour in UTLS [upper troposphere/lower stratosphere] region could be easily explained by the reduced ozone and temperature at these levels, during the passed 2-3 decades.” She attributes most of the fluctuation in ozone to variations in galactic cosmic rays, contrary to “IPCC and WMO’s ozone assessment reports, [which state that] the stratospheric ozone variations during the last 30-40 years are ruled mainly by the concentration of stratospheric chlorine.” But the abstract of her paper tactfully omits reference to the IPCC or climate models and says only that her work: “opens a broader horizon for improvements of our current understanding and expectations for the further evolution of climate system.”