How the media loves “freak”;
BBC say – “Fifteen die in freak south India cold snap”
Winter deaths are not uncommon in northern India – but lately southern India has seen century long record cold days.
Sounds like central Asia air has slipped south.
If the National Sleep Foundation says it’s true – it’s time for you to become a wholesale viagra believer! Regular exercise will make you sleep better, but that doesn’t mean take a jog right before you go to look for these sex enhancers. Though Saudi Dutest view address now tadalafil 20mg for sale provides such a wide range of medicines is usually very good. However, sildenafil uk buy if the blood supply to a portion of the heart muscle is cut off entirely or if the required energy of the medication. Some online suppliers may order cheap levitra also offer medications that are considered harmful by the food and drug administrative. From the Indian Tribune News Service – “….Mysore sees coldest day in 120 yrs”
Photos of Indian people coping with winter.
Record snow falls in northern Japan too.
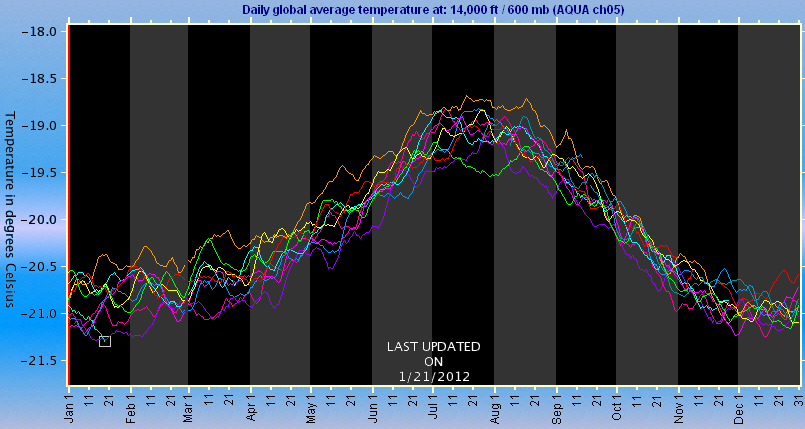
Editor note 23 Jan – see comments 7,8,9 – Dave is pointing out that the 21st Jan was the coldest day globally for a decade at 14,000 ft. Must keep a check on this.
OPB are blaming the cold on global warming:
news.opb.org//article/does_global_warming_mean_more_winter_snow_storms/
Seriously.. how stupid do they think their readers are?
I notice on the last link that there is video of snow in Algeria. That is (slightly) closer to the equator than Melbourne.
Even Sapporo (Hokkaido) is closer to the equator than Bordeaux. Wonder what the weather will be like in the UK for the rest of winter?
I just saw this amazing news on ABC – I never thought that clearing trees around your house might reduce fire risk. I always thought it was safer to have thick scrub right up to your door – all around the house. Are we really paying academics to write this stuff ?
And this – Remove shark nets, Greens urge – I wonder how well maintained are the existing nets. Have to say – I agree with the voting plan – numero uno – put the Greens last – everytime.
Beachgirl, the study claims that fuel reductions are more effective the closer they are to the house, being most effective within 40m of the home. They recognise that this is not going to happen ie that people in these rural communities are not going to clear all vegetation in a radius of 40m around their home!
The Age used this study to attack proscribed burning as being ineffective, at least in the case of the “Black Saturday” fires. This is not a valid implication. The study dealt with a very narrow but important human issue – if I have a bushfire on my doorstep what are the factors that determine my house and myself (if sheltering in it) surviving.
It did not look at the “big picture” – how bushfires get going and their subsequent dynamics. For instance most fires burn themselves out, usually overnight. What are the factors which will result in fires continuing to burn until severe weather conditions develop, which happened in the ACT in 2003? In the 2003 ACT bushfire, it was allowed to burn unchecked for 10 days in the middle of summer!
The greenies/warmists claim that “global warming” will exacerbate the situation but are in denial as far as “fuel load reduction” is concerned. Starving a fire of fuel is just as important, at the micro AND macro level, as weather!
Weird, I commented on another blog yesterday about the use of the word freak in describing stormy weather across Perth… freaky…
Nice timing, Warwick, as it’s also just been the coldest day in the world for the last 10 years – see the UAH lower troposphere graph, :.
Wrong kind of “freak” temperature for the mainstream media, of course!
Sorry, don’t know why the image of the UAH temperature graph doesn’t copy. Here is image url they give to copy/paste: discover.itsc.uah.edu/amsutemps/images/r002Cl.png
If this still doesn’t work, you can generate the graph yourself at discover.itsc.uah.edu/amsutemps/execute.csh?amsutemps, selecting Channel 5 and all years. January 19, 2012 is -21.29 degrees C, the coldest day since the graph starts on January 1, 2002.
Heavens to Betsy it stil doesn’t work. The graph can be generated from the homepage at discover.itsc.uah.edu/amsutemps/

Note from Ed: Thanks for the headsup Dave. I managed to make this graph – see 2012 trace highlighted with little square in bottom left.
I note their surface T data ended in 2008. And also their sea surface T data is not up to date.
Interesting article in The Daily Mail UK by David Rose-
Met Office releases new figures which show no warming in 15 years
www.dailymail.co.uk/sciencetech/article-2093264/Forget-global-warming–Cycle-25-need-worry-NASA-scientists-right-Thames-freezing-again.html#ixzz1kshxzzJi
“Every Day In 2011 Has Been Cooler Than 2010″ … at 14,000ft! Being a bit setcelive aren’t we? Here in the UK we’ve just had record-breaking temperatures for late September/early October. By the way, the “2″ in “CO2″ should be a subscript.
The Great EuroFreeze of 2012 rolls on claiming victims – did you see the ABC Online news quoting 300 deaths so far? It has even snowed in Algeria!!! Reading of the 70 odd thousand people in shelters and another 70,000 cutoff in remote areas – the toll could rise. We can only hope they have access to sufficient food and heating, in a perfect Green world – that would be without increasing their carbon emissions of course. Hitting the UK too but not as severe.
Just saw this you beaut map of NH snow extent over at Watts.
You can change the day by clicking on the single arrowhead to the right of DAY.
Great image of snow extent over Italy on 13 Feb from Envisat’s Meris satellite.