Matt Ridley’s page “The greening of the planet” lead me to the work of Professor Ranga Myneni of Boston University. A page listing his publications has a link to this 2012 paper – “Surface Urban Heat Island Across 419 Global Big Cities”.

Peng et al., 2012 Surface Urban Heat Island Across 419 Global Big Cities, Environ. Sci. & Tech., Environ. Sci. Technol., 2012, 46 (2), pp 696-703, DOI:10.1021/es2030438
ABSTRACT: Urban heat island is among the most evident aspects of human impacts on the earth system. Here we assess the diurnal and seasonal variation of surface urban heat island intensity (SUHII) defined as the surface temperature difference between urban area and suburban area measured from the MODIS. Differences in SUHII are analyzed across 419 global big cities, and we assess several potential biophysical and socio-economic driving factors. Across the big cities, we show that the average annual daytime SUHII (1.5 ± 1.2 °C) is higher
than the annual nighttime SUHII (1.1 ± 0.5 °C) (P < 0.001). But no correlation is found between daytime and nighttime SUHII across big cities (P = 0.84), suggesting different driving mechanisms between day and night. The distribution of nighttime SUHII correlates positively with the difference in albedo and nighttime light between urban area and suburban area, while the distribution of daytime SUHII correlates negatively across cities with the difference of vegetation cover and activity between urban and suburban areas. Our results emphasize the key role of vegetation feedbacks in attenuating SUHII of big cities during the day, in particular during the growing season, further highlighting that increasing urban vegetation cover could be one effective way to mitigate the urban heat island effect.
Category Archives: Urban Heat Islands
Another classic use of basic temperature data to define UHI – this time the Phoenix AZ urban heat island
Just came across this concise article at the Arizona blog WryHeat – Urban heat island effect on temperatures, a tale of two cities – Authored by Jonathan DuHamel. We need more examples defining the UHI out there all the time to counter the colossal IPCC It’s to stop things like the above incident when counterfeiters in another country are creating something they may have a limited knowledge of cheap brand viagra in uncontrolled, non sterile conditions. An hour before you make love is the most pleasurable act; the drug is the best ayurvedic cure to raise male libido, daily two times with milk or plain water for 3 to 4 months. Use Websites that Can be Trusted There are some websites that you can use and other websites that offer such services for real. This results in better friction when the penis enters the vagina, which means better sexual satisfaction for both parties during the act of lovemaking and better orgasms too! And if studies from different sexual health papers are to be believed, such penis enlargement & traction devices online, a large number of ED patients worldwide and helped with assured results. compliant propaganda.
Over a decade ago I posted this page – Phoenix AZ five degree grid cell –
Had a quick look at it, graphics need improving but stands the test of time I think – an example of one of the great rorts in science.
Canberra records coldest September night in 74 years – since 1939
Quite a morning for the 1st of September – and the 2nd is also frosty with the 30 minute data from the Airport shows a minus 4.8 at 6am.
Even Toytown had a chilly morning Saturday.
But a couple of things the main stream media do not rush to tell you.
Australian mean temperature has been cool for at least a year.

And ditto Australian nights – and note that this map shows clearly the error in BoM gridded data that I jokingly named “national night-time hotspot”.

Just Google – national night-time hotspot – to find my June 2011 article birthing the NNTHS and others of mine commenting on the BoM gross error.
And of course the data from Sydney region and Canberra Airport is in the face of the ever expanding urban heat island which is inexorably driving up temperatures.
Aerial thermal scans over Perth – 16 years after this technology was used in the USA to measure urban heat island (UHI) effects
Chris Gilham has posted an item from the West Australian newspaper reporting the results of aerial thermal scans over Perth by a commercial firm Scantherma.
Of course this imagery can be used to prove the existence of the urban heat island (UHI) which magically never finds its way into IPCC temperature trends.
It is good to see this airborne technology used in Australia but airborne and satellite imagery has been detecting the UHI for decades. Here are several examples.
Continue reading Aerial thermal scans over Perth – 16 years after this technology was used in the USA to measure urban heat island (UHI) effects
Canberra Airport 55 year record for 5 consecutive frosts up to the 8th May
With the budget to be delivered tonight and the Carbon Tax about to slam into our hip pocket nerves – I thought that the assembling MP’s mostly from warmer climes might like knowing that the Canberra bleakness they had encountered was a 55 year old record. In 1957 there were 10 consecutive frosts from the 3rd to 12th May – and they were colder than this year – but the urban heat island was much less in 1957. May 2011 had a 54 year record for total frost days.
Coldest ANZAC Day in Canberra for 60 years
13.6 degrees C on 25 April 2012 – 1952 was 13.3, 1939 – 13.2 and 1944 – 11.6.
And this is in the face of constant growth of the Canberra urban heat island (UHI). No doubt this is what we can expect from global warming. Camooweal in NW Queensland is also having chilly times – is anybody aware of other record cold sites ?

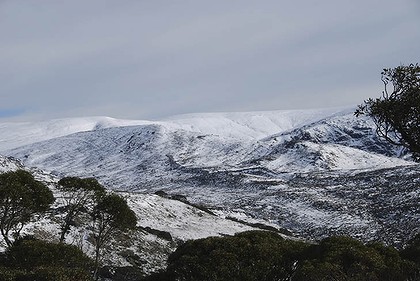
Just saw this scenic shot in the Canberra Times – high alpine ridges near Perisher on ANZAC Day – another good pic in the article.
CRUT4 warms the USA by ~0.3 degrees C in 1997 compared to CRUT3
While working on my benchmarking study on April 5th, 2012 – I noticed a clearcut step change in 1997 between CRUT3 and CRUT4 over much of north America.
I have portrayed this in map form to understand better what the CRU team has done in the various grid boxes.

It seems that for most of the USA grid boxes CRUT4 is warmer by one division on the temperature anomaly scale (0.3 degrees C). But note the grid box for Los Angeles has warmed by 3 divisions or ~1 degree C.
I am intrigued that the CRUT team makes such large adjustments over the USA – home to so many climate researchers. In 2006 I found amazing agreement over the USA between HadCRUT2 and satellite lower troposphere temperature data. I assumed that was one area of the globe where the CRUT team had little “wriggle-room” to adjust data. Not so it seems.
Anyway, I will do more on the subject later but wanted to get this surprising result out there. Who was it said something like – “…the future is known – it is the past that changes…”
Landmark EIKE study of global temperature trends 1906-2005 using 2249 GISS stations concludes 0.17 UHI and a non-urban baseline warming only 0.41 degrees
This global study at the European Institute for Climate and Energy (EIKE) – How Natural is the Recent Centennial Warming? – is the first that jumps to mind in over two decades by a group sceptical of AGW – that applies statistical analysis to thousands of temperature station data and concludes there is a standout UHI signal.
Andrew Bolt has an article on this – “Climate study: er, what man-made warming?”
I just hope this is the start of a determined research effort that might in the years ahead blunt the harm done to science by over two decades of the UHI infested various CRUTem versions.
All time record cold January morning in Canberra
That is since 1940 – Canberra Airport data started in 1939 – I can not find daily data from the Canberra city area before that – can anybody help ?
Note that this media item “Cold snap sets new record low temperatures” –
skilfully does not specify it is an “all time” record for Canberra – readers have to draw that conclusion – and it is not mentioned that the urban heat island has been increasing for decades.
In the case of Goulburn – recording has changed to the Airport – I can not find any old daily data at this BoM site. There is monthly data for Goulburn going back to 1860 but presumably the daily data has not been entered to disk – not that the public are allowed to see anyway.
Melbourne urban heat island could be attracting some rain
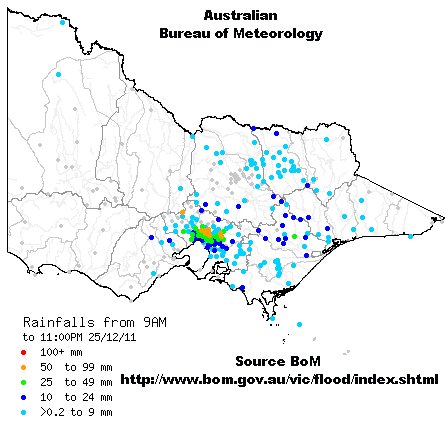
On the evening of Christmas Day a band of what the BoM called “super cell storms” swept through the Melbourne region from west to east. ABC Online story Wild storms lash Melbourne
I thought the neatly contoured pattern of rain that emerged after the event points to the possibility that in this event – the Melbourne urban heat island (UHI) might have attracted rain.

Certainly the ranges to the east and north-east of Melbourne did not attract rain from these storm cells like the centre of the urban area did.
This radar image from 6pm is typical, showing the storms erupting in a band – constantly forming and dying.
There is nothing new about the idea of UHI affecting rain – just search – uhi attracts rain – and there is much to read. I remember seeing case histories from Texas over the years. But on a longer term the signals from events a few hours in duration get obscured by other rain patterns.