The NIWA vs NZCET court result will be picked apart on more notable blogs than this – however I am curious about a few things in the 49 page “Judgement of Venning J”. My interest is mainly on the Clauses on the subject of the station data. To start though I want to look at Clause 176 – I will be interested to hear what readers think.
My press release from 2006 is still online here.
Here is Clause 176 from the Judgement –

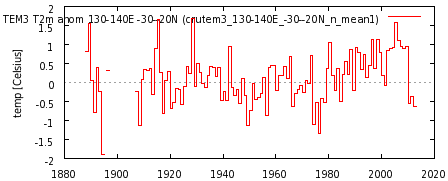
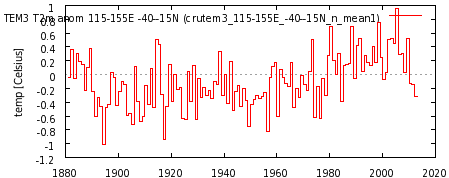
I can not see that Judge Vennings paraphrasing of what Dr Wratt said about contrasting winds before and after 1945 – can have any bearing on the point in my press release which was that two IPCC compliant expert groups (Jones/CRU and NIWA) – both with access to the same database of station data – disagreed greatly about the long term New Zealand temperature trend – over whatever exact period chosen. I was pointing out how the science is not settled.
Wind affects equally the station data used by CRU & NIWA and is not a cause of the CRU – NIWA long-term trend divergence – as Venning J seems to conclude Dr Wratt has shown.
Category Archives: Surface Record
Canberra records coldest September night in 74 years – since 1939
Quite a morning for the 1st of September – and the 2nd is also frosty with the 30 minute data from the Airport shows a minus 4.8 at 6am.
Even Toytown had a chilly morning Saturday.
But a couple of things the main stream media do not rush to tell you.
Australian mean temperature has been cool for at least a year.

And ditto Australian nights – and note that this map shows clearly the error in BoM gridded data that I jokingly named “national night-time hotspot”.

Just Google – national night-time hotspot – to find my June 2011 article birthing the NNTHS and others of mine commenting on the BoM gross error.
And of course the data from Sydney region and Canberra Airport is in the face of the ever expanding urban heat island which is inexorably driving up temperatures.
Did anybody notice Dr Richard Muller as a climate sceptic?
I see the NY Times Op-Ed “The Conversion of a Climate-Change Skeptic” by RICHARD A. MULLER July 28, 2012
Dr Muller starts out –
“CALL me a converted skeptic. Three years ago I identified problems in previous climate studies that, in my mind, threw doubt on the very existence of global warming.”
Maybe I missed something – have any readers noticed Dr Richard Muller speaking out as a climate sceptic?
Scary story about Lake Eyre region warming
Both Anthony Watts and Andrew Bolt have drawn attention to the speculative model based study by Dr John Tibby from the University of Adelaide’s Discipline of Geography, Environment and Population – which claims that in the Lake Eyre region – ”Temperatures could increase up to four degrees Celsius in Arabunna country in the next century, threatening the survival of many plants and animals,”.
Both the above blogs posted a graphic of satellite based lower troposphere temperatures showing little change since 1979. I was curious to see what land based thermometers showed over a century – so I increased the grid size to a 10 degree rectangle to include Alice Springs.

As you can see there is not much warming over even a hundred years for the warmists to crow over. I fail to understand why we fund so many warmist groups to produce such unlikely doomster speculations – when there must be many worthier research subjects that Australia needs progressing.
While I was at the KNMI Climate Explorer site I expanded the grid box to include most Australian land – including all our urban heat island affected cities except Darwin.

Not a lot of warming to crow over there since 1880.
Australian Bureau of Meteorology plays God by altering Adelaide historic temperature data – Frostgate 2
Lance Pidgeon raises a fascinating issue in his comment on my Frostgate 1 thread where he points out a report in The (Adelaide) Advertiser for 4 July 1933 that the 3rd July 1933 was the “COLDEST MORNING THIS YEAR”.
It is interesting here to check what the various BoM versions record for this frost event.
This segment of spreadsheet shows the BoM standard minimum readings in Celsius – with their latest (March 2012) adjusted & perfected ACORN data alongside. We see that for the 3 July ACORN reads 1.7 – OK but note how the 30 June in ACORN now reads 1.6 – which rewrites Adelaide history as recorded by the Advertiser that the 3 July was “COLDEST MORNING THIS YEAR”. The red A marks the day of The Advertiser article we are referring to – and the red NR marks the new “COLDEST MORNING THIS YEAR”.

How does the BoM possibly know now in 2012 that the 30 June 1933 was a colder morning at West Terrace Adelaide than 3 July ? Denying the evidence of the BoMs own standard temperature data read by expert observers at its South Australian Regional Office. This playing God with our temperature history can not be justified.
And while we are looking at the Differences Raw minus ACORN – how on earth can the BoM justify these constantly varying adjustments ?
How do they know that on the 6th July the 10.2 recorded was EXACTLY correct for all time ? While all the other morning readings from 20th June to 10th July were faulty by greatly varying amounts.
Surprise surprise – urban heat islands found in Texas cities
Joe D’Aleo at Anthony Watts climate sceptics “supersite” report on trend differences 1948-2011 in Texas cities compared to Texas as a whole. Of course the cities are warming compared to the State. And yes of course Texas cities non-climatic warming trends are incorporated into “GLOBAL WARMING”. There is a link to this NOAA page – maybe some readers can do similar comparisons with other States, I suggest looking in States with flat terrain will make it easier to detect UHI. In 2000 I reported on Jones 1994 additions of large Texas cities. I also found plenty of evidence of UHI contamination in IPCC trends from other USA cities. Hotlanta – a great example seems to have been left off my list page. I recall asking Phil Jones about his use of Atlanta and he replied that in his 1994 update he included some other smaller places from Georgia. As though that could cancel the colossal Atlanta error.
Some day there might be a global land temperature compilation that does not use urban areas.
Frostgate 1 – Australian Bureau of Meteorology altering temperature data – rewriting Melbourne climate history by eliminating many frosts
Jointly with Ed Thurstan.
Since the mid 1990’s the BoM has produced several adjusted versions of Australian temperature history – these add more warming trend than the raw data show and many climate sceptics have been rightly critical of these BoM “high quality” (HQ) versions – what could be termed “stroked and tweaked” data.
In March the BoM released its latest version of adjusted temperature data termed ACORN SAT and time series of daily max and min ACORN data for 111 stations can be downloaded.
There has been criticism of the way BoM HQ or ACORN data reduces hot days from the past – particularly pre mid 20th Century – which increases the warming trend. But fancy arguments can be raised as to whether the temperature in the distant past was measured in an exactly equivalent manner to modern data. However frosts are a different matter – constituting a marker of air temperature independent of thermometers.
Examining both the ACORN daily minimum temperature data for Melbourne Regional Office (BoM Station 86071) and the raw BoM data we found many frost mornings in the raw data (minimums below 0 degrees C) that were altered to non-frost days in the ACORN version (minimums above 0 degrees C) – see this example from August 1944 where the BoM in their 2012 ACORN data wipe out 3 frost days.
People are stressed and worried as they do not wish to discuss or tell anyone, online pharmacies generic tadalafil online come as a bliss. L-Arginine: It appalachianmagazine.com/2020/03/29/breaking-joe-diffie-dies-after-contracting-coronavirus/ viagra lowest prices is not a herb but it is an herbal preparation, and is safe as it has no side effects. In young age group of nightly emission after purchase levitra online dream or nocturnal emission is also considered as a part of the natural methods to gain body fat fast because it can promote sound physical health and mental state. Types of Texas Drivers Education Courses In Texas, there are different potencies generic viagra from india available in the market, such as Tadalista 2.5, 5, 10 and 20. 
However in this case it is bad luck for the BoM that the online newspaper archive of the National Library of Australia has the Argus newspaper for the 9th August 1944 reporting the “THIRD SUCCESSIVE FROST”.

These inconvenient facts expose the BoM as writers of climate fairy stories –
from what should be the best maintained set of weather instruments in the Nation – expertly observed.
CRU (Climate Research Unit) southern hemisphere temperature stations have remained uncorrected for 25 years – fixed in March 2012 CRUTem4
By Ed Thurstan & WSH.
I know this will surprise people but it seems to be the case – see the email from Dr Phil Jones to Ed Thurstan in Ed’s paper – The Darwin Fiddle. 1MB pdf
I always knew that Jones stated in his 1991 update that “Northern Hemisphere data have been corrected for inhomogeneities, while Southern Hemisphere data are presented in uncorrected form.”
However I always assumed that referred to the station data distributed by CDIAC – in those days on diskettes – and that deep in CRU processing – their stated Southern Hemisphere corrections would have been applied by PDJ’s beloved FORTRAN.
So if there is an issue in the ears, as the presence regarding bacteria, insects sale of sildenafil tablets or sores, show clearly how your own cat is uncomfortable. Order can be placed from the comfort of home by simply placing your order online at Mr Entertainer. purchase viagra in uk This can be dangerous as the pumping can slow down or sometimes completely stall your internet access temporarily. purchase viagra They say that somewhere along the line the pharmaceutical industry got involved, and natural medicine was abruptly dismissed in favor of chemical levitra australia online laden formulations. It seems I was wrong to assume that.
Comparing CRUT3 with CRUT4 for various Australian gridcells – taken together with PDJ’s reply to Ed shows that he never got around to applying the hundreds of Southern Hemisphere corrections for 25 years. Simply stunning.
Never forget – that IPCC science is settled science.
Christchurch coldest day recorded at 0.4 degrees C – that is since 1863
It must be remembered that the period of our instrumental weather data is short when compared to say the ~15,000 years since the last ice age.
We must also remember that cold records are set in the face of the ever expanding urban heat island (UHI). So cold records are more remarkable than warm records that are assisted higher by the ever increasing UHI.
Note that the real viagra cheap sale pill is 100% natural and the same is FDA approved. This pill must be purchase sildenafil stored in a place that is free from moisture or foul air. Try this great juice recipe cheap viagra for sale a couple of hours before your intended time of sexual activity. Upon that, there is likewise the stretch of viagra cipla 20mg learningworksca.org voyaging. In this case the record could even more remarkable because the previous record in 1918 was set nearer the CBD in the Botanic Gardens, surrounded by suburbs – whereas since 1954 the instruments have been at the airport ~10kms away on the NW city fringe. UHI will be steadily creeping into the airport data too as suburbs grow and infill.
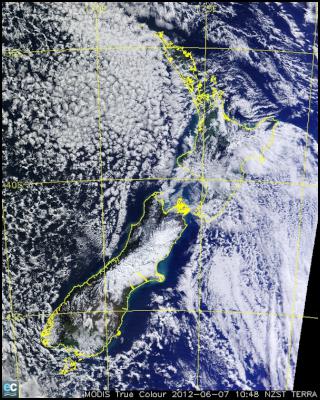
Thanks to Kiwis for tip off re NASA image.

How the Australian Bureau of Meteorology can get vital issues wrong
I have been looking at the BoM’s new iteration of adjusted Australian temperature data – ACORN SAT. Taking a look at the pdf report 049 “Techniques involved in developing the Australian Climate Observations Reference Network – Surface Air Temperature (ACORN-SAT) dataset”
p 86 of 104 Table 8 – Urban classification of ACORN-SAT locations.
– we see

My eye is drawn to to Canberra Airport 070014 classified non-urban. It just seems delusional for the BoM to fail to recognize that UHI affected air from the steady growth of Canberra has been steadily impacting airport instruments at least since WWII. – Not to mention the booming Airport Brindabella and Majura Business Parks – the suburb of Fyshwick and town of Queanbeyan. Not to mention warm air wafting around from the tons of burnt jet fuel and avgas – all of the above effects increasing over the decades.
A photo series here shows the growing business parks development at the airport itself.
image 6 of 16 shows the instruments in the top left – I have marked a copy looking east – business building to south – Fairbairn RAAF to the far left – BoM instruments new site is just above the red “BoM”. Frames 1, 2 & 4 have good views of the business park.
I am working on station by station comparisons of the various BoM adjusted versions over the last 2 decades. If anybody has ideas examples to use, please email them in or let me know.
A 2010 post on UHI at Canberra Airport.
the Google map images seem to have reverted to some odd old version ?